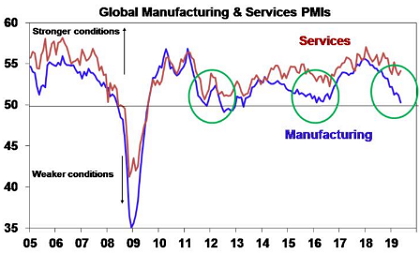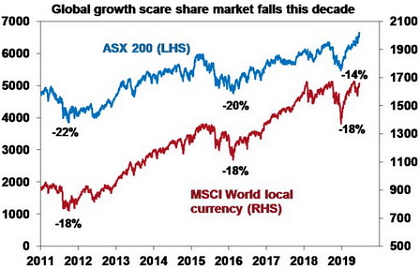
This decade has now seen three global growth scares – around 2011-12, 2015-16 and now since last year. Each have been associated with softening business conditions indicators (or PMIs) as indicated in the next chart – see the circled areas.

Source: Bloomberg, AMP Capital
And each have been associated with roughly 20% falls in share markets.

Source: Bloomberg, AMP Capital
All have seen central banks shift towards easing to varying degrees. And in the first two this saw growth indicators pick up again and share markets rebound and clearly move on to new highs. We now seem to be seeing a re-run – at least with respect to central banks.
Central banks go from tightening to neutral to easing
It had looked like a shift from a tightening bias to a neutral/slight easing bias – the US Federal Reserve’s “patient” “pause” and end to quantitative tightening and the European Central Bank’s new round of cheap bank financing (what they call TLTRO) and pushing out its guidance on how long it won’t be raising interest rates for – would do it for the Fed and the ECB this time.
But then the trade war resumed in May adding to a new round of fears about global growth and inflation. And so the ECB and Fed look to be going beyond neutral and back to “whatever it takes”, joining central banks in China, India, Australia, New Zealand and other countries in easing:
-
ECB President Mario Draghi has indicated this week that “in the absence of improvement…additional stimulus will be required” and that it “will use all the flexibility within our mandate to fulfil our mandate”. Further ECB easing could include more rate cuts (taking them further into negative territory) and a return to quantitative easing. ECB easing in July or September is looking very likely.
-
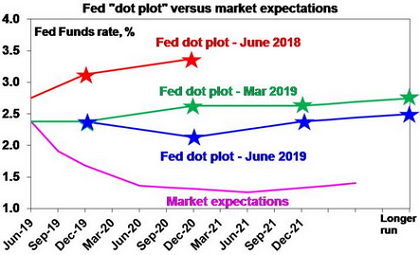
The US Federal Reserve at its June meeting has clearly shifted in a very dovish direction strongly hinting at interest rate cuts ahead. It downgraded its economic activity assessment from “solid” to “moderate”, it noted falling inflation expectations, it dropped the reference to being “patient” in raising rates, it noted that uncertainties have risen, it lowered its inflation forecasts to below the 2% target and it said it will “closely monitor” the economy, which is often code for moving to easing. While its dot plot of Fed officials’ interest rate expectations still sees rates on hold this year, it’s now line ball with 8 out of 17 officials now seeing a cut of which 7 see two cuts and many of those who have rates on hold see an increased case for a cut and it only requires one of those to shift for the dot plot to move to a cut this year. What’s more, the dot plot now sees a cut next year and it has lowered the long run rate to 2.5%. The dot plot is well down from a year ago when three rate hikes were indicated for this year and one for next year. Overall, absent a clear move towards resolution of trade issues and much better data the Fed looks on track for a cut in July and we continue to see two Fed rate cuts this year.

Source: US Federal Reserve, Bloomberg, AMP Capital
The shift towards monetary easing by the Fed and ECB risks ramping up currency wars again – at least in the minds of commentators – but as we have seen in the past this is just a means of spreading easing globally. And many central banks are already easing anyway.
This is of relevance to the Reserve Bank of Australia, which would prefer to see a lower Australian dollar. The Fed now moving towards easing does make the RBA’s job a little bit harder on this front. However, we still see the RBA easing more than the Fed as the Australian economy is weaker than the US economy and has much higher labour market underutilisation than the US (13.7% of the workforce in Australia versus 7.1% in the US). So, we still see the Australian dollar heading down to around $US0.65 by year end. But Fed easing which will weigh on the $US generally is one reason why the $A is unlikely to crash to past lows.
Presidents Trump and Xi to meet
In the meantime, Presidents Trump and Xi will meet at the G20 meeting in Japan next week. This could lead to a delay in the next round of tariff hikes on China – on the roughly $US300bn of remaining Chinese imports. Ultimately, I expect a deal to resolve the trade dispute because of the threat to growth in both countries (and the risks this poses to Trump’s 2020 re-election prospects). But given the false starts so far it’s not clear this round of meetings will do it just yet.
But it looks like we will get some combination of a trade deal/easier monetary policy or no trade deal and even easier monetary policy.
Implications for investors
The risks are higher this time around given the trade war mess and with the US yield curve inverting – although it does give false signals, has long lags and may be distorted by the threat of more quantitative easing, recently it may more reflect a plunge in inflation expectations as opposed to growth expectations and the normal excesses that precede US recessions aren’t present to the same degree now.
And there will be bumps along the way, i.e.) shares could still go down in response to weak economic data and trade upsets before they go up and we are in a seasonally weak part of the year.
However, for investors it’s always worth remembering the old line “don’t fight the Fed”…or the ECB or RBA, etc. This is because low rates make shares cheaper and can help boost earnings.
While there is scepticism that central banks with the ultra low/negative rates and QE will do the trick, an investor would have made a huge mistake over the last decade betting against them!
So while the risks are higher this time around, my inclination is still to see the current period as just another global growth scare like those in 2011-12 and 2015-16 which will give way to somewhat stronger growth globally and higher share markets on a six to 12 month view.
If you would like to discuss any of the issues raised by Dr Oliver, please call on Phone 02 9906 6566 or email admin@jacksonfinancial.com.au.
Source: AMP Capital 20 June 2019
Important notes: While every care has been taken in the preparation of this article, AMP Capital Investors Limited (ABN 59 001 777 591, AFSL 232497) and AMP Capital Funds Management Limited (ABN 15 159 557 721, AFSL 426455) (AMP Capital) makes no representations or warranties as to the accuracy or completeness of any statement in it including, without limitation, any forecasts. Past performance is not a reliable indicator of future performance. This article has been prepared for the purpose of providing general information, without taking account of any particular investor’s objectives, financial situation or needs. An investor should, before making any investment decisions, consider the appropriateness of the information in this article, and seek professional advice, having regard to the investor’s objectives, financial situation and needs. This article is solely for the use of the party to whom it is provided and must not be provided to any other person or entity without the express written consent of AMP Capital.
